The Vision Professionals
As a professional, I feel like I am a first-year teacher. All new methods and expectations. A lot of documentation, more than instruction. Lots of lesson planning, overplanning, individualizing materials more often. I miss the social interaction and support of colleagues. —White female TVI
Four hundred eighty-one TVIs, O&M specialists, and dually certified professionals completed the survey, with 470 (98%) having worked in the 2019-2020 school year. During the 2019-2020 school year, 271 (58%) worked as TVIs, 65 (14%) as O&M specialists, 85 (18%) as dually certified professionals, 10 (2%) as general or special education teachers, 2 (>1%) as paraprofessionals, 9 (2%) as student teachers, and 28 (6%) in other roles.
During the current school year, of the 481 vision professionals who completed the survey, 301 (63%) were working as TVIs, 79 (16%) as O&M specialists, 87 (18%) as dually certified professionals, and 9 (2%) as student teachers. Six (1%) individuals were not currently working in any of these roles.
When asked about their licensure or certifications, 372 vision professionals indicated they were certified by their state or provincial departments of education, 23 were working as TVIs on emergency certification, 140 were certified as O&M specialists by the Academy for Certification of Vision Rehabilitation and Education Professionals (ACVREP), and 1 individual held the National Orientation and Mobility Certification (NOMC). Twenty-five professionals reported they worked as O&M specialists but were not certified by ACVREP or NOMC. There were 5 TVI student teachers and 4 O&M specialist interns.
Of the 470 vision professionals, 395 worked full time through one employer, 13 (3%) worked full time through multiple employers, 51 (11%) worked part time, and 10 (2%) had other work schedules. The professionals were asked who their employers were with multiple responses allowed. Not surprisingly, 270 professionals worked for public school district(s), 62 for educational service districts or cooperatives, 43 on campus for specialized schools, 35 for outreach departments of specialized schools, 48 for state or provincial agencies, 30 were private contractors, and 22 worked for non-profit organizations. Other responses provided by participants included early childhood centers, rehabilitation agencies, and post-secondary transition programs.
Four hundred sixty-six vision professionals were currently serving students with visual impairments, some providing services in multiple ways. There were 282 professionals working as itinerant teachers and seeing students in multiple buildings in one district, 152 itinerant teachers seeing students in multiple districts, 98 providing home visits for early intervention, 72 serving students in center-based early childhood programs, 51 working at specialized schools, 44 working in resource rooms, 31 serving students at charter or private schools, and a few participants providing services in other settings including state/provisional offices, rehabilitation programs, and transition programs.
Caseload Composition
Although the researchers recognized that students with visual impairments are a heterogenous group, for the purposes of collecting and reporting the data, the professionals were asked to think about their students in three broad categories.
- Academic blind students.These are students who are primarily included in the general education classroom, whose primary literacy medium is braille and are able to read on or close to grade level.
- Academic low vision students. These are students who are primarily included in the general education classroom whose primary literacy medium is print and are able to read on or close to grade level.
- Students with additional disabilities. These are students who may spend part, if not most, of their day, in special education classrooms. They typically are two or more grade levels below nondisabled peers. Their educational programs are very individualized.
Using the provided definitions, professionals were also asked to think about the way in which they delivered services to each of their students.
- Direct service students refer to students who professionals meet with regularly to provide instruction in the ECC. TVIs likely adapt materials for these students as well as ensure they have what they need in their classrooms to succeed. O&M specialists provide service to address specific travel-related goals..
- Consultative students refer to students who professionals monitor or check in with periodically. Professionals may consult with the student and/or other members of the educational team.
Professionals were asked the total number of students on their caseloads and the total number of students they were currently not serving, that is, students who were not attending school or students they were unable to contact. There were 9 TVIs and 2 dually certified professionals who reported they were serving 50 or more students. For professionals serving 1-49 students, 282 TVIs reported having a mean of 14\.64 (SD=8.42) students on their caseload with a mean of 3.27 (SD=4.95) students they were not serving. Seventy-five O&M specialists reported the mean of students on their caseload was 15.49 (SD=9.50), and they were not currently serving a mean of 2.22 (SD=4.81) students. The 86 dually certified professionals reported a mean of 19\.80 (SD=11.34) students on their caseload, and they were not currently serving a mean of 1.48 (SD=2.28) students.
Table 9 reports mean and standard deviation for the number of students on the caseloads of itinerant professionals for those professionals serving 1-49 students. As some professionals reported, they delivered services in more than one mode (e.g., itinerant and resource room); all professionals who selected “itinerant” as a setting in which they delivered services are included in Table 9.
Table 9: Mean and Standard Deviation of Students Currently Receiving Direct and Consultative Services from Itinerant Professionals
| TVIs (n=291) | O&M Specialists (n=77) | Dually Certified Professionals (n=84) | ||||
|---|---|---|---|---|---|---|
| M | SD | M | SD | M | SD | |
| Direct Service | 11.28 | 9.23 | 13.95 | 8.80 | 15.33 | 16.82 |
| n=203 | n=50 | n=75 | ||||
| Consultative | 6.14 | 8.53 | 2.99 | 3.45 | 6.56 | 6.42 |
Reaching Families and the Digital Divide
The researchers wanted to understand from the professionals how many of the families of their students they were and were not able to reach. Of the 466 professionals, 263 (58%) reported they were able to reach between 91% and 100% of their students’ families. There were 122 (25%) professionals who were able to reach between 76% and 90% of their students’ families. Eighty-one (17%) of the professionals were only able to reach between 25% to 49% of their students’ families. Professionals provided reasons they were not able to reach family members, including not having a current phone number or email address, unstable home environments, families not having Internet access, language barriers, and family members who are unable to dedicate time to their child’s education. Some family members recognized that their child would not have the ability to attend online classes due to their multiple disabilities. Therefore, these families opted to not participate in online education.
[The] biggest challenge is getting parents on board. Many of the students I work with do not work independently online, so parents need to be present or able to facilitate. I know this is not always an option, whether it be due to work or family commitments, mental health, or it’s not a priority for them, etc. Some parents just have not replied to the emails, texts, phone calls. So, I try to limit the amount to give them space. —Female family member of a child with low vision and additional disabilities, 11 to 12 years old, and a TVI
Educators and policymakers cannot assume that all children and families have ac- cess and tools to engage in remote learning. Those children and families who do not have access to the Internet, devices, or have low Internet bandwidth are said to be on the low end of the digital divide. Professionals were asked to indicate the percentage of the students they serve who did not have Internet availability, device availability, and/or enough bandwidth. Though 204 (44%) of 465 vision professionals reported their students had Internet and device availability in addition to enough Internet bandwidth, 184 (40%) professionals reported that between 1% and 25% of their students were on the low end of the digital divide. Some students were on the low end of the digital divide because the technology tools they were given by the district were not accessible to them. This was especially true with Chromebooks which have small screens and are often locked down so that changes cannot be made that would allow students to have better visual access or screen reader software such as JAWS to be installed. Other students had not been given any technology that would allow them to access online education, had not received training for them or their family members in how to use technology they received, or required assistance with online learning with no one in the home available to provide assistance.
All of my students did not have the technology that they needed last spring, but they did get it this fall. They do not all have good Internet access, but they have enough to get by. Poor Internet interrupts video lessons. The families that did not have their own devices have had a large learning curve on how to use the technology. The digital divide combined with non-English speakers have put my students at a great disadvantage. —White female TVI
The Impact of School Policies on the Education Of Students
Frequent changes in policy and caseload shifts have made it difficult to get a consistent schedule. I have a remote teaching accommodation currently so this doesn’t apply to me but my colleagues who are seeing kids in person can only go to one building period (which makes sense from a safety standpoint), but they had to choose which kid on their caseload to see in person. This is very unfair to them and to their students. It has also made it difficult for kids to get their O&M services in a way that would be most beneficial for them. —White female TVI
Vision professionals had varying experiences with policies of their school/agency administration and these variations impacted them and their students and their students’ families. Some administrators were clear in their communication, were prepared to move to remote education, and provided appropriate technology for vision professionals and students to access online education. They had clear policies for in-person interactions and provided adequate PPE.
Other administrators were reported to not be supportive of the education of students with visual impairments. For example, in some districts students with visual impairments were not permitted to attend in person even when in-person education was more appropriate for the students’ learning needs than online instruction. For some professionals, there were barriers to obtaining the technology students needed to have access to in order to participate in online education. And even when the students had the technology, in some instances, policies prohibited modifying the setup to allow the students to use accommodations (e.g., white print on black background) or load assistive technology software (e.g., JAWS) on to district-issued technology.
Not surprisingly, there were vision professionals who reported that both they and family members experienced anxiety and stress due to lack of guidance or direction from the district, especially in regard to educating students with visual impairments who had significant additional disabilities or deafblindness. Orientation and mobility specialists especially found some district policies made it challenging for them to do their jobs effectively. The practice of orientation and mobility is a hands-on practice that involves travel in many ways including in the school, neighborhood, or via public transit. Restrictions on travel challenged O&M specialists to think creatively on how to meet student IFSP and IEP goals. In many instances this was not fully possible.
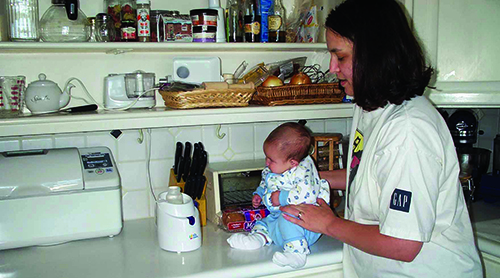
Virtual instruction just does not cut it for working on all of the O&M skills that need to be repetitive and hands-on in person to ensure a student’s safety. —White female TVI
Ways In Which Vision Professionals Were Delivering Services In November 2020
For just over half of the 466 vision professionals (n=244, 52%), there was a delay to the start of the school year. When the school year started, 292 professionals found their school districts, agencies, or specialized schools delivering instruction using multiple delivery models (e.g., online, hybrid), and they were teaching in these different delivery models. In November 2020, 137 professionals were providing instruction using multiple delivery models.
Table 10 reports data from 292 vision professionals who indicated different delivery models and plans for the school district(s), specialized school, or agency at both the start of the school year and in November 2020. Participants could select as many options as applied to their situation. What is apparent from the data in Table 10 is that service delivery models and policies continued to be in flux several months into the school year. Since the start of the school year, there has been an increase in the number of professionals who reported that some of their students were receiving in-person instruction. The number of professionals who reported at the start of the school year that the plan was to move students from online to in-person instruction dropped considerably by the time the professionals completed the survey, an indicator that as positive COVID case numbers and deaths rose, districts, specialized schools, and agencies struggled to come up with safe ways to return to in-person learning.
 br/>
br/>Table 10: Responses from Professionals Describing Educational Delivery Models at the Start of the School Year and in November 2020
| Description of Service Delivery | Start of School Year (n=292) | At Time of Survey (n=292) |
|---|---|---|
| In-person in-buildings using COVID-19 safety precautions | 190 | 249 |
| Hybrid with some students always online and some students in the classroom | 130 | 172 |
| Hybrid where students spend part of their time in person and part online | 130 | 142 |
| Online instruction with plans for special education, high-needs, and/or at-risk students to have the option to come into buildings for in-person instruction | 142 | 139 |
| Online instruction with plans to remain online until at least January | 106 | 132 |
| Hybrid with the option to go back to all online instruction | 92 | 115 |
| Hybrid with the option to move to in-person instruction | 88 | 104 |
| Online instruction with plans to move students to in-person instruction | 198 | 88 |
| Online instruction with plans to remain online through the 2020-2021 school year | 26 | 41 |
| Students are in school buildings but TVIs and/or O&M specialists serving multiple schools are not allowed to provide in-person instruction | 27 | 24 |
One hundred seventeen (29%) of 407 vision professionals reported that administrators limited the number of school buildings they could enter, while 36 (9%) professionals were unsure if there were any restrictions.
Changes to IEPs and IFSPs as a Result of the Covid-19 Pandemic
Several of my goals, especially [in] braille learning (reading and writing), have changed. They have not been removed but altered so that it is a better fit with their hybrid schedules. Other goals like listening skills and eye condition project presentation goals have also had to be altered as they were not conducive to Zoom sessions. Finally, a typing goal had to be changed completely as it wasn’t possible to teach this skill via Zoom. —Multiracial female TVI
Two-thirds (n=312, 67%) of 466 professionals reported they had worked with either an IFSP and/or IEP team to make changes to the plan due to COVID-19. Though 116 (25%) of the professionals reported no changes were made to any student plans, 38 (8%) reported they had students who they believed needed to have their IFSPs or IEPs changed due to COVID-19. Table 11 presents the changes to IFSPs or IEPs that TVIs and O&M specialists reported as having occurred. Dually certified professionals had the opportunity to answer as both a TVI and O&M specialist.
Table 11: Responses from Professionals Describing Educational Delivery Models at the Start of the School Year and in November 2020
| Change | TVI | O&M Specialist |
|---|---|---|
| Changed from direct to consultation services | 64 | 46 |
| Changed from consultation to direct services | 22 | 8 |
| Changed amount of direct service time | 127 | 51 |
| Changed amount of consultation service time | 53 | 14 |
| Changed IFSP or IEP goals typically addressed by the TVI or O&M specialist | 92 | 50 |
| Eliminated IFSP or IEP goals typically addressed by the TVI or O&M specialist | 28 | 19 |
| Removed educational team members | 16 | 0 |
| Added goals to address student's need to engage in online learning | 71 | 23 |
| Worked with the team to develop an addendum that only applies when the student is receiving hybrid or online instruction | 132 | 45 |
In thinking about how the COVID-19 pandemic was impacting their services to students, the vision professionals were provided options to indicate changes they had personally made to student IFSPs and IEPs so that they could continue their work. There were 131 vision professionals who reported they had made no changes to IFSPs or IEPs that reflected changes in the amount of service time. One hundred eighty-five vision professionals reported making changes, and these changes included:
- Decreasing the amount of direct service time (n=133)
- Increasing the amount of time the professional consults with other team members (n=72)
- Increasing the amount of direct service (n=58)
- Decreasing the amount of consultation time (n=49)
- Increasing the amount of consultation time (n=49)
- Decreasing the amount of time the professional consults with other team members (n=22)
For service delivery changes, there were 220 vision professionals who had made no changes to IFSPs or IEPs. Eighty-eight vision professionals reported making changes to IFSPs or IEPs, and these changes included:
- Changing services from direct to consultation (n=72)
- Changing services from consultation to direct (n=28)
- Changing the student from an IEP to a 504 Plan (n=6)
- Changing the student from a 504 Plan to an IEP (n=4)
In the area of goals and accommodations, there were 68 vision professionals who had made no changes to IFSPs or IEPs. Two hundred fifty-one vision professionals reported making changes, and these changes included:
- Changing where and when the professional provided services (n=165)
- Changing accommodations the student receives because of the educational model (e.g., online, hybrid) the student was participating in (n=142)
- Adding goals because of the way the student was receiving instruction/services (e.g., online, hybrid) (n=94)
- Removing goals because of the way the student was receiving instruction/services (e.g., online, hybrid) (n=85)
- Changing goals and/or accommodations due to restrictions to activities the student participated in with typical peers (e.g., PE class) (n=68)
Vision professionals were asked about other changes made to students’ IFSPs and IEPs. Though 181 vision professionals indicated no changes had been made, 109 vision professionals reported one or more changes had been made including:
- Changes to transportation for the student (e.g., private car, rather than school bus) (n=62)
- Addition of educational team members to address student needs because of the way the student was receiving instruction/services (e.g., online, hybrid) (n=41)
- Removal of educational team members because of the way the student was receiving instruction/services (e.g., online, hybrid) (n=38)
Access to Materials
I am not handling this lack of materials with much grace or any real sense of forgiveness as I feel these students, really most remote students, are being left out of meaningful educational experiences these days. —White female O&M specialist
Before the pandemic, TVIs and other professionals (e.g., braille transcribers, paraprofessionals) spent considerable time coordinating the provision of materials so that students with visual impairments had full access to the curriculum alongside classmates. To do this successfully required clear communication and the development of systems to share information and materials. During the pandemic, many TVIs reported it was challenging, if not impossible, to coordinate with the class- room teacher in order to know what content would be covered in upcoming lessons, to get necessary materials prepared for the student, to get access to manipulatives and tools needed by the student, and to get everything to the student attending school online in time for the lesson.
In addition, vision professionals needed materials such as eye charts to conduct assessments. For some students, they needed access to materials to engage the child in learning, such as individualized calendar systems, choice boards, or adapted switches.
Students also need to have access to materials so they can access and complete their schoolwork. It is not reasonable to expect a family to provide all the necessary materials for their child. In the same vein, not all families have a place to store materials, and many family members also do not know how to use materials that their child may not be able to use independently.
Table 12 reports data from the vision professionals showing the percentage of vision professionals who reported having the materials they needed to provide for their students’ instruction when students were online. It also shows the percentage of students who vision professionals reported had the materials they needed in their home to participate in online instruction. Students with visual impairments and additional disabilities were less likely to have at home the materials they needed to participate in their education than students who did not have additional disabilities.
Table 12: Availability of Materials for Professionals and Students
| TVIs | O&M Specialists | Dually Certified Professionals | ||||
|---|---|---|---|---|---|---|
| Percentage of Vision Professionals Who Report They Have Needed Materials | ||||||
| n | % | n | % | n | % | |
| Blind | 184 | 70 | 49 | 86 | 60 | 70 |
| LV | 250 | 84 | 60 | 87 | 77 | 77 |
| AD | 252 | 77 | 63 | 79 | 79 | 76 | Percentage of Professionals Who Report Students Have Materials in the Home to Participate in Online Education |
| n | % | n | % | n | % | |
| Blind | 130 | 71 | 37 | 76 | 45 | 78 |
| LV | 218 | 81 | 43 | 84 | 62 | 73 |
| AD | 223 | 64 | 44 | 61 | 66 | 59 |