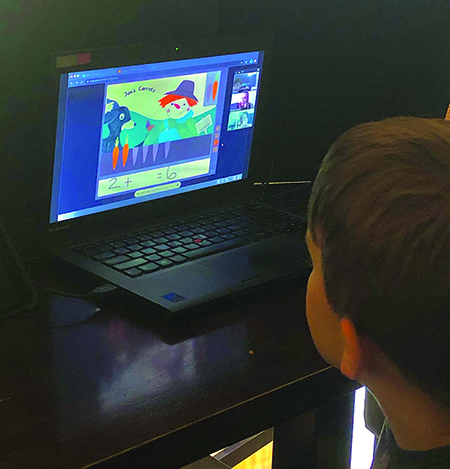
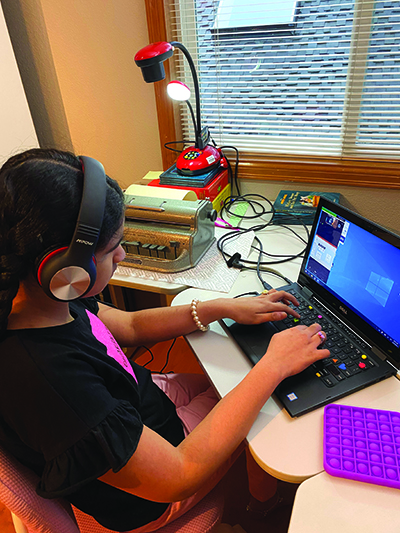
Everybody has had to adapt to crazy things that are not very normal. People are getting tired of this [COVID-19] stuff but we have to move forward with the education of our young people with all the organizations and programs and services offered. —Family member of a child with low vision, and a preschool child who is blind with additional disabilities, 2.5 to 3 years old
As this report goes to press in May 2021, we are one year into the COVID-19 pandemic. We know the landscape of education is changing in many ways. It is too early for us to know what changes may occur in the percentage of children graduating high school in 2020–2021 compared to previous years.
Though no one knows the long-term impact of the pandemic on the education of children, families, and professionals, we can all agree that there have been short-term impacts. At the same time, there have been beacons of hope, creativity, and collaboration. These have warmed the hearts of many and brought some families and professionals closer together in their joint mission to ensure our students with visual impairments, including those with additional disabilities and deafblindness, receive an equitable, accessible, and engaging education.
As a follow-up to the first Access and Engagement study conducted in April and May 2020, the Access and Engagement II study seeks to answer the question:
In the fall of 2020, nine months into the COVID-19 pandemic, how is the education of students with visual impairments in the United States and Canada being impacted?
By fall 2020, both Americans and Canadians realized that the COVID-19 pandemic was not going to be short-lived. Data collection for Access and Engagement II took place from October 28, 2020 to November 30, 2020. Therefore, the survey results captured what was happening in both the American and Canadian educational systems following a summer when there was time to prepare for educational delivery during the pandemic.
According to the Centers for Disease Control and Prevention, as of March of 2021, there were 30,085,827 total confirmed cases of COVID-19 in the United States, compared to 1,145,733 in May of 2020. Of those cases, 2,532,205 were among children from birth to 17 years of age, compared to 3,615 the previous spring.3
As of March 2021, a total of 527,726 deaths had been reported in the United States (compared to 6,091 deaths in May of 2020) of which 295 were children between 0 and 17 years of age (compared to only six deaths in children as of May of 2020).
According to the Government of Canada, in March of 2021, there were a total of 965,404 COVID-19 cases and 22,880 deaths.4. Of those cases, 148,674 were children 19 years and younger with 295 reported deaths. By comparison, in May of 2020, at the beginning of the COVID-19 pandemic, Canada reported 90,179 total cases of COVID-19 and no deaths had been associated with the virus.5
Across both countries, there was variation in how educational services were being delivered in November 2021, from fully in person to fully online and everything in between. Many students, families, and professionals were experiencing COVID fatigue. In addition, many Americans and Canadians knew someone who had become ill with COVID and, in some cases, died from the virus. Though a vaccine was on the horizon, when these data were collected, no vaccines had been approved for emergency use in either country.
Survey Design and Analysis
The survey design was similar to that used for the first Access and Engagement study. The survey was divided into six sections which individuals had the option to complete. Throughout the survey there were some required questions. The sections each targeted the following groups:
Family member of a child, birth to 3 years of age, receiving early intervention
Family member of a student, 3 to 7 years of age, enrolled in a preschool program
Family member of a school-age student in K-12 or transition
TVI employed for the 2020-2021 school year
O&M specialist employed for the 2020-2021 school year
Dually certified professional (TVI and O&M specialist) employed for the 2020–2021 school year
At the end of the survey, all participants completed a demographic section.
The survey was made accessible for users of screen readers (e.g., JAWS, NVDA, VoiceOver). Only adult family members and professionals completed the survey; no children were invited to participate in the study. Professionals provided their own demographic information; family members provided demographic information for themselves and their child(ren). Family members were invited to complete data for a second child in the same category. Only two family members of school-age children provided data for two children, so these data are not reported separately.
Participant Recruitment and Limitations
In the spring 2020 Access and Engagement study, a limitation of the research was the lack of demographic diversity in the study sample, with 79% of participants being white and 87% being female. Though recognizing the lack of diversity, the authors, organizations, and companies supporting this research were unable to alter the demographic composition of the study sample in their recruitment efforts. In Access and Engagement II, 85% of participants were cisgender female and 81% were white, nearly identical to the prior survey.
In both studies, only individuals who had access to the Internet received information about the study, and the survey tool was only available online.
The survey opened on October 30, 2020, just a few days before the 2020 U.S. presidential election. The distraction of the election coupled with “COVID fatigue” may have contributed to a low response rate. In spring 2020 for the first Access and Engagement study, the sample size was 1,432; for Access and Engagement II, the sample size was 662. No identifying information was collected from participants in either sample, so we do not know how many, if any, of the same participants completed both surveys. Had these data been collected, it would have allowed the researchers to conduct some longitudinal analysis by individual.
Demographic Characteristics of Adult Participants
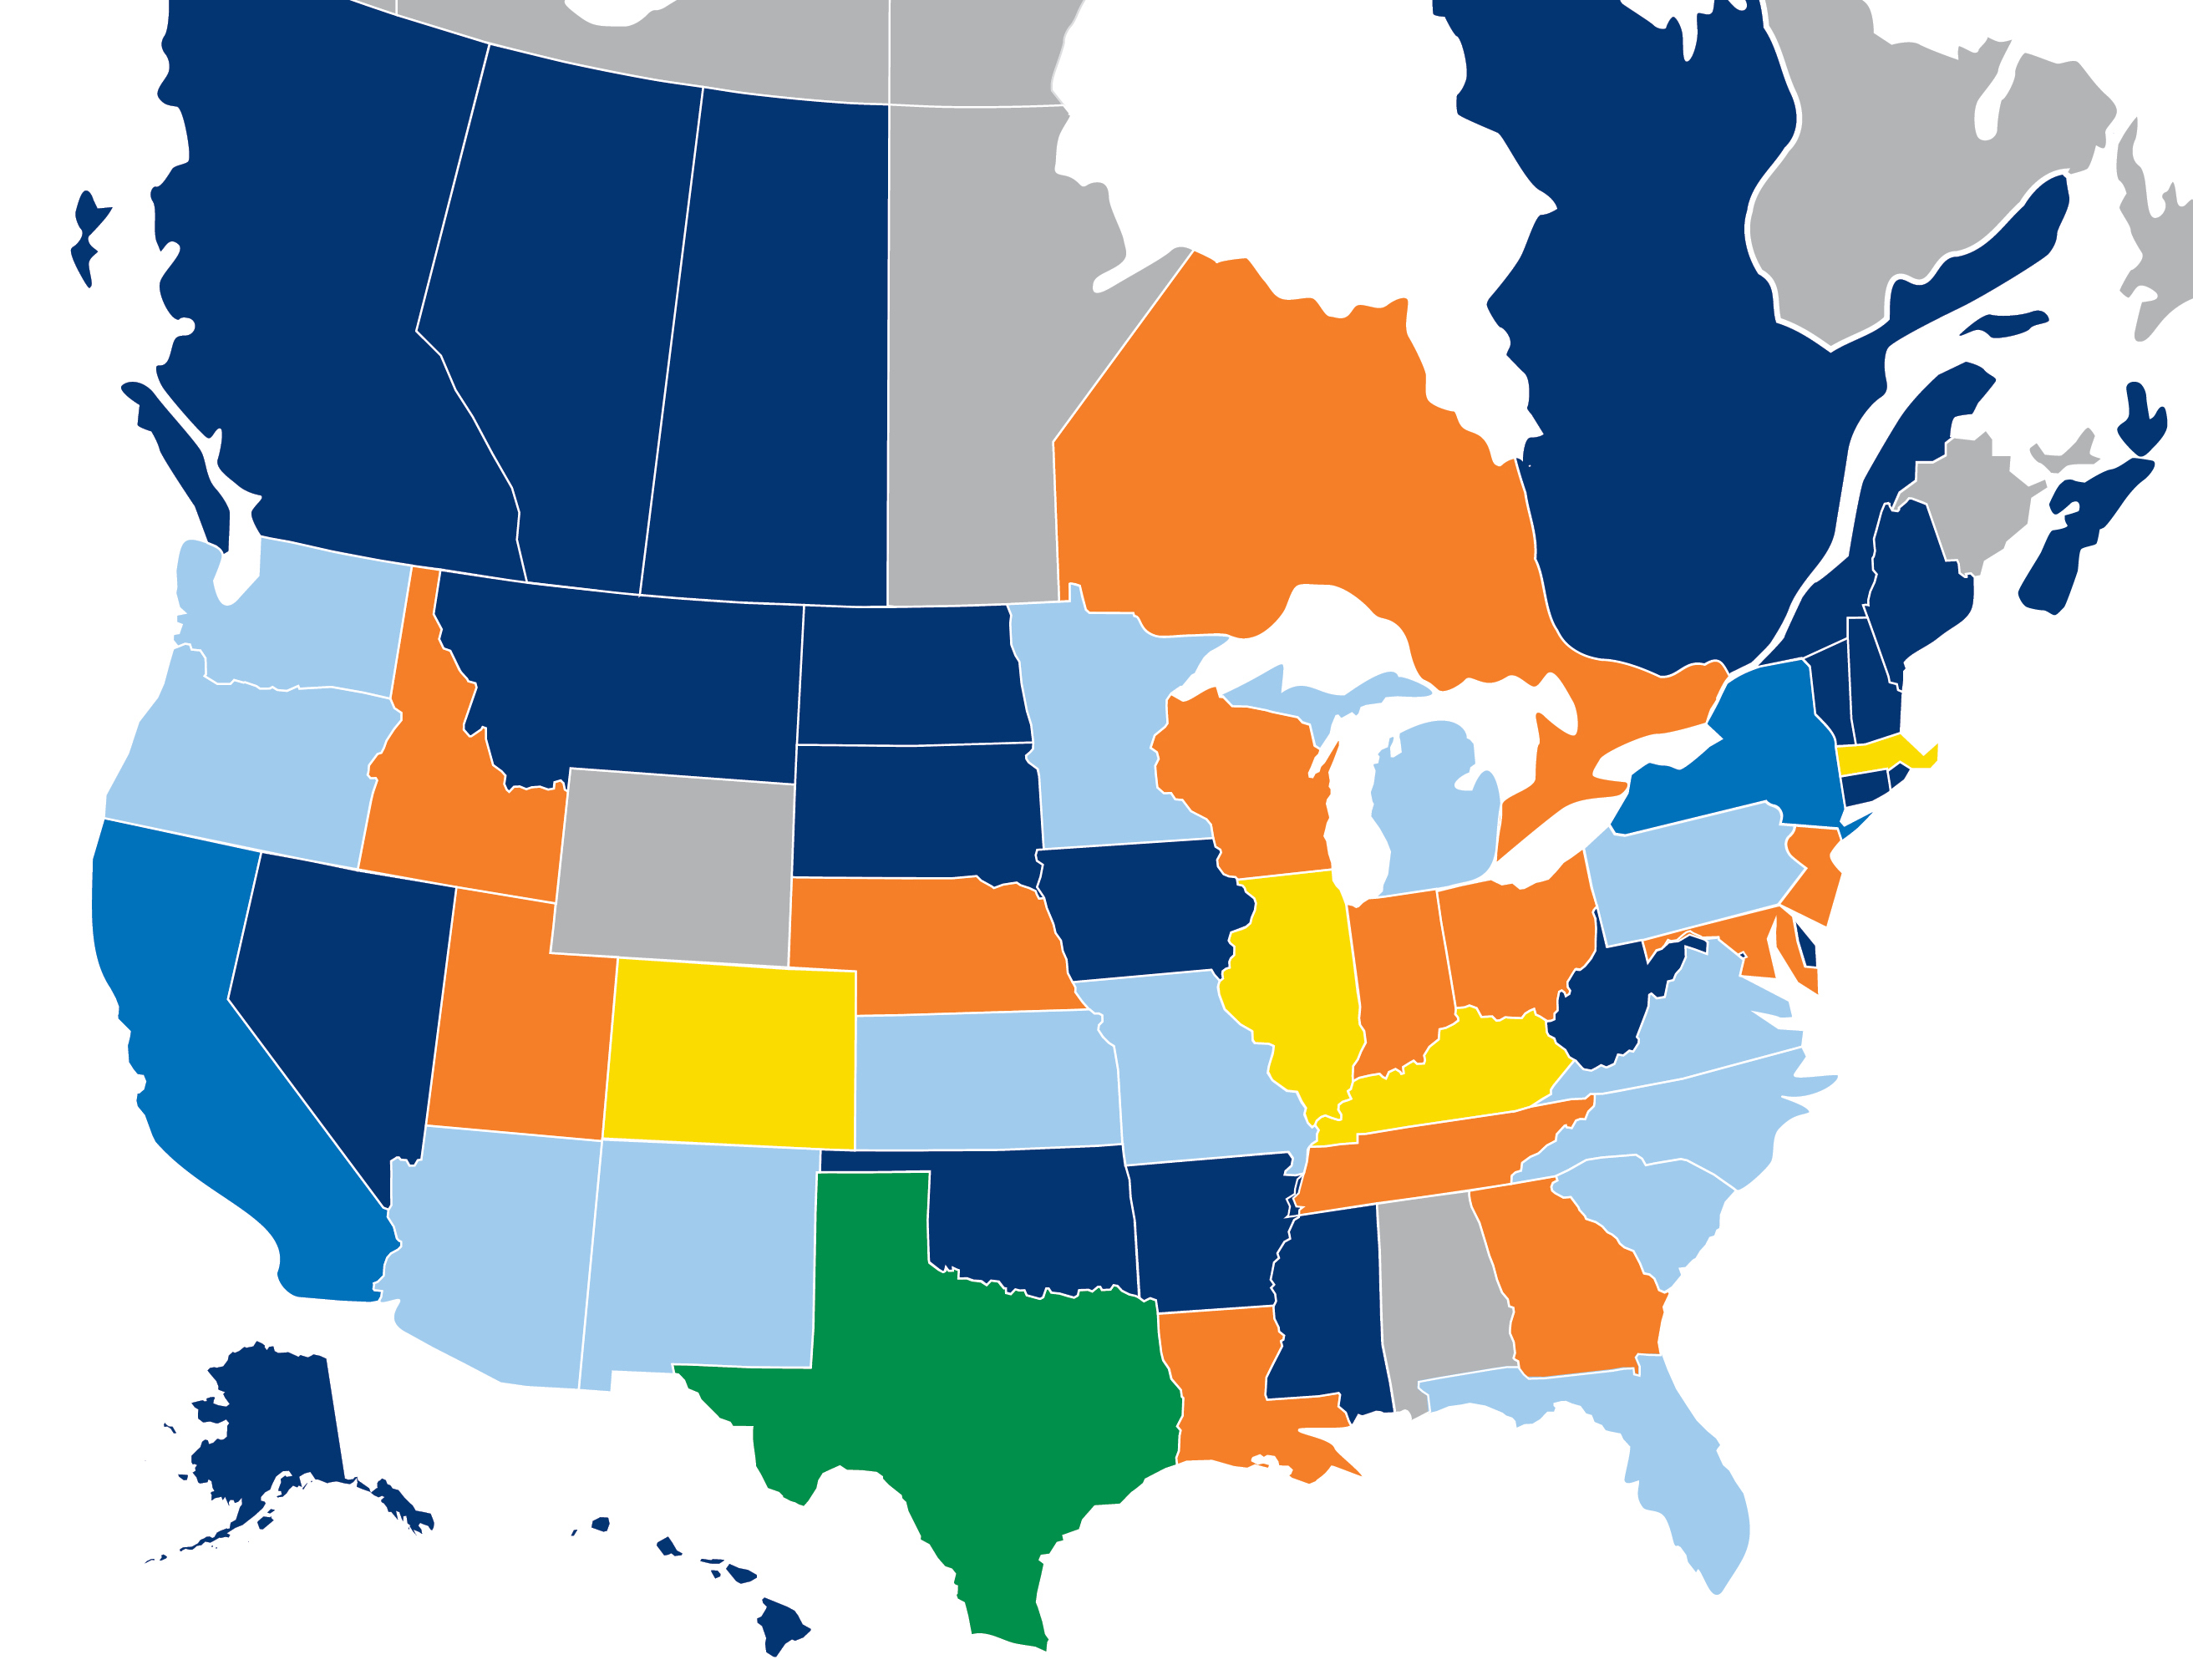
Six hundred sixty-two adults completed the Access and Engagement II survey, with 21 from Canada and 641 from the United States. The Canadian participants represented 6 provinces and the American participants represented 48 states and one individual overseas. There were 611 participants who provided data on the state or province in which they lived.
Table 1 provides participant demographic data for gender, Table 2 provides participant demographic data for age, and Table 3 provides participant demographic data for race/ethnicity (U.S. only). There were 39 U.S. participants who identified as being of Hispanic or Latinx descent. In examining the race/ethnicity data of 15 of the Canadian participants, 9 (60%) were White, 4 (26%) were East Asian, 1 (7%) was South Asian, and 1 (7%) was of Indigenous descent. Four hundred and two (40%) participants reported they had no additional disabilities or other health conditions. There were 18 participants who self-identified as blind and 40 as having low vision.
Table 1: Demographic Data of Participants by Gender
| Characteristic | n | Percentage |
|---|---|---|
| Gender of U.S. and Canadian Participants (n=631) | ||
| Cisgender female | 549 | 87.0 |
| Cisgender male | 48 | 7.6 |
| Gender not listed | 1 | 0.2 |
| I prefer not to provide this information | 33 | 5.2 |
Table 2: Demographic Data of Participants by Age
| Characteristic | n | Percentage |
|---|---|---|
| U.S. and Canadian Participants (n=631) | ||
| Under 25 years | 8 | 1.2 |
| 26-35 years | 82 | 12.3 |
| 36-45 years | 176 | 27.9 |
| 46-55 years | 197 | 31.2 |
| 56-65 years | 125 | 19.8 |
| 66+ years | 28 | 4.4 |
| I prefer not to provide this information | 15 | 2.4 |
Table 3: Demographic Data of Participants by Race/Ethnicity
| Characteristic | n | Percentage |
|---|---|---|
| U.S. Participants (n=624) | ||
| American Indian/Alaska Native | 8 | 1.2 |
| Asian | 8 | 1.2 |
| Black/African American | 20 | 3.0 |
| Native Hawaiian/Pacific Islander | 1 | 0.2 |
| Two or more races | 11 | 1.7 |
| White | 522 | 78.6 |
| Other | 16 | 2.4 |
| I prefer not to provide this information | 38 | 5.7 |
The participants were asked to describe their current employment. Of the 160 family members, there were 2 (1.3%) who chose not to provide the information. There were 13 (8.1%) family members who were not working before the pandemic and continued to not work, while 18 (11.3%) family members stopped working to care for children, and 17 (10.6%) family members had been caring for children or extended family members prior to the pandemic and continued to do so. Within the family member group, there were 34 (21.3%) essential workers who worked outside the home, 21 (13.1%) non-essential workers who worked outside the home, and 45 (28.1%) family members working from home. In addition, 9 (5.6%) family members were laid off, furloughed, or lost their job. Of the 16 participants who were both family members and professionals, there were 7 who worked outside the home and 9 who worked from home.
Technology Availability for Children Learning from Home
Table 4 provides information about the number of children learning from home and Table 5 provides the number of access technology tools available in the home. In both tables, data are reported for participants who are family members only, those who are both family members and professionals, and those who are professionals only. With the exception of one professional, all participants had Internet service in their home, with two family members reporting that their Internet service was paid for by someone other than an individual living at home (e.g., employer, school district).
Table 4: Mean and Standard Deviation of Children in the Home of Family Members Only, Family Members Who Are Professionals, and Professionals Only
| Family Member Only (n=168) | Family Member-Professional (n=16) | Professional Only (n=471) | |
|---|---|---|---|
| Number of children living at home | 2.13 (1.09) | 2.56 (1.79) | 1.13 (2.03) |
| Number of children participant is caring for | 2.05 (1.04) | 2.94 (2.72) | 1.03 (2.04) |
| Number of children enrolled in early intervention, preschool, or school-age education | 1.60 (1.11) | 2.00 (1.46) | 0.86 (2.01) |
Table 5: Number of Technology Tools Available in the Home of Family Members Only, Family Members Who Are Professionals, and Professionals Only
| Family Member Only (n=168) | Family Member-Professional (n=16) | Professional Only (n=471) | |
|---|---|---|---|
| Smartphone | 165 | 15 | 433 |
| Tablet | 152 | 13 | 363 |
| Laptop | 152 | 13 | 417 |
| Desktop computer | 74 | 6 | 177 |
| Smart speaker | 103 | 6 | 182 |
Participants were asked about the groups of people in their home who used the Internet and had devices. These data are reported in Table 6.
Table 6: Frequency, Mean, and Standard Deviation for Access to the Internet and Device Availability
| Family Member Only | Family Member-Professional | Professional Only | |
|---|---|---|---|
| Working from Home | |||
| n | 131 | 15 | 399 |
| M | 1.4 | 1.4 | 1.8 |
| SD | 1.3 | 0.7 | 1.5 |
| Attending School from Home | |||
| n | 132 | 15 | 197 |
| M | 1.7 | 2.1 | 1.0 |
| SD | 1.5 | 1.6 | 1.8 |
| Number of People Who Can Be Online at the Same Time | |||
| n | 165 | 15 | 410 |
| M | 3.9 | 3.8 | 3.5 |
| SD | 1.7 | 1.7 | 2.2 |
| Number of People Who Have Their Own Device | |||
| n | 150 | 15 | 400 |
| M | 3.1 | 3.6 | 2.5 |
| SD | 1.9 | 1.7 | 1.8 |
Participants were asked to select their level of agreement with the statement: I believe the Internet access we use (at home or at another location) allows the children in my home to fully participate in online or hybrid education. Of the 618 participants who responded, the mean was 3.73 (SD=1.2).6 The level of agreement participants had with this statement fell between “Agree” and “Strongly agree.” Readers must recognize that this survey was administered through the Internet so the high agreement with this statement suggests the sample may not be reflective of those who have no or inconsistent Internet or who lack devices to use to get online.
Participants’ Experiences with COVID-19 and Employment
Data were collected during the ninth month of the COVID-19 pandemic. Participants were provided a list of statements that described the types of experiences they had had with COVID-19. Of the 618 participants who responded, 17 preferred not to answer the question. Five participants reported that someone in their home had tested positive for COVID-19, and one participant reported someone who lived in their home had died from COVID-19. The six most frequently selected COVID-19 experiences were:
No one in my home has exhibited symptoms or been tested for COVID-19. (n=362)
One or more people in the workplace of someone in my home has tested positive for COVID-19. (n=183)
One or more people in my home have/had COVID-19-like symptoms, have been tested, and have tested negative. (n=146)
One or more people in my home have had other COVID-19 experiences with those close to them. (n=91)
An extended family member or close friend not living in my home has died because of COVID-19. (n=56)
One or more people in my home have/had symptoms that may be COVID-19, but no one has been/was tested. (n=21)
For many individuals in the United States and Canada, their employment status had changed as a result of the pandemic. Though 359 (58%) participants reported there was no change in their employment status, for 181 others, there were changes. One hundred six (59%) of the 181 family members reported some type of change, while 211 (44%) of 481 participants who were either both family members and professionals or professionals only reported changes. Participants were provided a list of possible changes to employment with multiple responses permitted. Although 16 (2.6%) of all participants chose not to answer the question, for those who reported changes, the seven most frequently reported changes were:
One or more people in my home have transitioned to working from home because their employer allowed/required them to work from home due to COVID-19. (n=157)
One or more people in my home had their work hours reduced because of COVID-19. (n=103)
One or more people in my home were laid off or furloughed because of COVID-19. (n=66)
There have been other changes in the employment status of one or more people in my home because of COVID-19. (n=43)
One or more people in my home have quit their job(s) or reduced their hours in order to be home to supervise/support children who are learning from home because of COVID-19. (n=33)
One or more people in my home lost their job because the business they worked for closed because of COVID-19. (n=31)
One or more people in my home are currently looking for a job because of COVID-19. (n=25)
3. https://covid.cdc.gov/covid-data-tracker/#cases_totalcases
4. http://www.canada.ca/en/public-health/services/diseases/2019-novel-coronavirus-infection.html
5. https://www150.statcan.gc.ca/t1/tbl1/en/tv.action?pid=1310078501
6. The mean (M) is derived by averaging the participants’ ratings—from “Strongly disagree” (1) to “Strongly agree” (4). The larger the standard deviation (SD), the greater the spread from the mean of the participants’ ratings.


