The use of small displays on consumer electronics and other devices has become commonplace. These displays, which we call small visual displays (SVDs), are found on everything from mobile phones to office document centers to home medical equipment, such as blood glucose meters. The ability to read the information displayed on most of these devices is critically important to a person who is trying to use the device, but the small size and poor contrast of many displays makes this difficult.
The purpose of the SVD project at American Foundation for the Blind's AFB Tech lab, first described in Lee Huffman's July 2009 AccessWorld article, is to identify and assign value to the characteristics of a display which contribute to its readability and, then, use this information to raise awareness for consumers about their choices in display quality and to influence manufacturers to improve the quality and readability of displays for all consumer devices. This article will serve as a brief overview of the major components of this project with more detailed articles to follow.
The planned outcomes of the SVD project are as follows:
- An optics lab to identify and assign values to the characteristics of a display that are important to readability, such as font size and type, contrast, glare, etc.
- A database containing all of the information collected using the lab, including an easy-to-use readability rating scale that will be made free to consumers.
- Guidelines for manufacturers to follow based on the assigned values to characteristics which will produce a more readable, quality display image (image quality metric), currently in development.
Display Characteristics
Contrast and font size have long been accepted as the two factors that most affect readability. Contrast is simply the difference in the brightness we perceive between the foreground and background or, in the case of text, the font color against the background color. A display with high contrast and a large font is the easiest to read in almost all cases, such as black, 18-point font on a white background. During testing, the AFB Tech lab also considers reflections (glare) from external lighting, which cause a reduction in contrast in the analysis of a display.
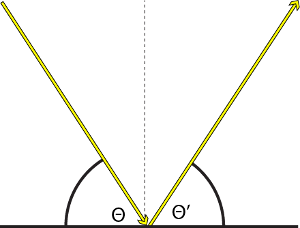
AFB Tech considers two types of reflection in its measurements. Specular reflections are the type of reflections that you observe in a mirror. This is caused by a very flat, smooth reflecting surface. When light rays hit the surface, they bounce off of the surface at the same angle (but on the opposite side). This results in a sharp reflected image, which is what you see in a mirror.
Caption: Specular Reflection: Light is reflected at the same angle from the smooth surface.
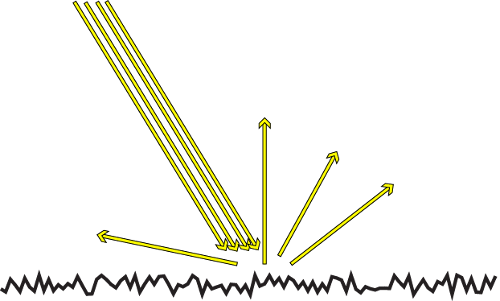
Diffuse reflection occurs when the reflecting surface is rough on a microscopic level, which causes light to be scattered in all directions when it reflects. A perfect diffuse reflector produces no reflected image at all. A blank piece of white copy paper is a good example of a diffuse reflector. No matter what angle you look at it, the paper looks white and evenly illuminated. Any given surface can have a diffuse component, a specular component, or a combination of both.
Caption: Diffuse Reflection: Light is scattered off of the microscopically rough surface in all directions.
Display Technologies
There are several types of display technologies found on the market today, and the lab classifies them based on the way they operate. Conventional display technology is described as being either reflective or emissive and fixed-segment or pixelated.
The first classification describes how a display manipulates light to produce images for the user. A reflective display changes the way it reflects light to produce an image. Since the display reflects light back at the user, an external light is needed to view the display, and therefore, it can't be used in the dark. Sometimes manufacturers solve this problem by placing a faint blue or orange light into the display, which can be turned on and off. This light is usually called a "backlight," which is a bit of a misnomer since the light is technically in front of the display.
The alternative to a reflective display is an emissive display, which operates by giving off its own light. These displays do not require external illumination and can be used in the dark. In fact, using an emissive display in a lighted room will reduce the level of contrast produced, such as when it is difficult to read a cell phone's display screen out in the sun.
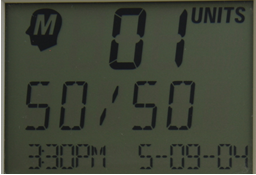
The second classification describes how a display screen changes to provide information for the user. A fixed-segment display is the type of display found on cheap or simple devices that only need to produce very specific information, such as numbers or labels. A good example of this is an alarm clock, which needs to have numbers for the time, labels for am and pm, and perhaps a symbol for whether or not the alarm is enabled. Numbers 0-9 are produced using seven small line segments, which are toggled on and off, while the labels and text keep the same form.
Caption: A reflective (needs external light), fixed-segment display
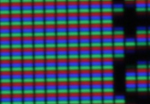
A more complex and flexible display technology is a pixelated display. This type of display uses a grid (or matrix) of tiny elements called pixels, which are turned on and off to produce images, text, or anything else that needs to be displayed.
Caption: An emissive (self-lit), pixelated (matrix of microscopic dots) display screen (color)
Liquid Crystal Displays (LCDs) are the most common type of display screens found on consumer electronics. LCDs can be designed to be reflective or emissive and are commonly found as both fixed-segment and pixelated designs.
Caption: A reflective, pixelated (monochrome) LCD on a blood glucose meter
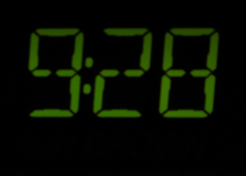
Light Emitting Diode (LED) technology is a purely emissive technology that produces very high contrast, but these displays are almost always limited to fixed-segment, simple displays like alarm clocks.
Caption: An emissive, fixed-segment LED screen on an alarm clock
Organic LED (OLED) technology is a new type of technology emerging onto the electronics market. These displays are always emissive and usually are pixelated. Another new, intriguing type of display is known as e-paper, most commonly found on book readers because of its similarity to conventional print on paper.
The Need for an Optics Lab
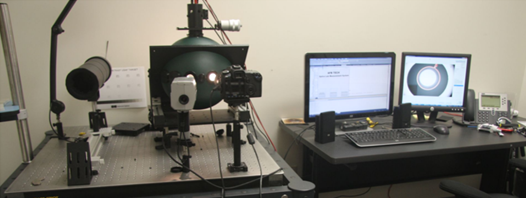
When AFB Tech started looking at the problem of SVDs, there was intuition and research to prove that contrast and font size were important, but it quickly became apparent that, without a way to assign value to these measurements, there would never be any progress with manufacturers. The engineers for the manufacturers want to know to what degree a display needs to be made better, and more importantly, they want to know what a minimum standard for readability is. To answer these questions, AFB Tech made a plan for an optics lab, applied for funding from several sources, and enlisted help from industry experts, such as Dr. Ed Kelley, who was an integral part of creating the standards that are used throughout the display industry, and others. As a result of this effort, AFB Tech has a state-of-the-art lab using procedures developed for measuring contrast and reflection properties by experts in the field.
Caption: AFB Tech's Optics Lab
Database
To make this lab useful to consumers, AFB Tech is uploading the data collected into a publicly accessible database. Currently in development is a way to condense the measurement data into a more useful "rating scale," which will allow consumers to have a direct comparison of two products on the basis of the display quality and readability. The lab is currently purchasing products from the entire spectrum of consumer electronics in the following major categories to expand this database: mobile phones, home health equipment (blood glucose monitors, pulse meters, blood pressure monitors, etc.), home appliances, office equipment, e-book readers, and digital media players. This database is scheduled to be launched in November, and an announcement will go out in AccessWorld with an in-depth look at its features.
In the Future: Contrast Sensitivity and the Image Quality Metric
AFB Tech, in coordination with Dr. Ron Schuchard with the VA, is currently researching whether or not an image quality metric, which is simply a way of measuring how "good" an image looks to a person, can be used to predict the readability of a display. An image quality metric takes into account both a display's level of contrast and a user's contrast sensitivity, meaning the metric is specific to an individual/device pair. This type of metric has been previously developed and tested using people who are fully sighted on CRT monitors (older-style tube televisions) to measure perceived image quality. Now, the lab and Dr. Schuchard are retesting this concept for SVDs and looking for a link between image quality and readability.
The ideal outcome for this part of the project would be the ability to measure an individual's contrast sensitivity and be able to accurately predict whether or not that individual could read a particular display effectively. While this scenario is not likely to pan out in the near future, the concepts we learn about the needs of the human visual system (both with and without any specific pathology) can be incorporated into recommendations given to manufacturers to help improve the quality of their displays.
The next article on the optics lab will be a discussion of the image quality metric, its components, and its implications, along with a description of the contrast sensitivity simulator the lab developed to help illustrate the specific effect that reduced contrast sensitivity has on a person's vision.
